TST LAB / TST Wonders
How Scientists Read an Atmosphere from Starlight
When a planet crosses its star, a thin slice of starlight filters through the atmosphere. Its wavelength-dependent changes can reveal chemistry—but only through careful models and uncertainty checks.
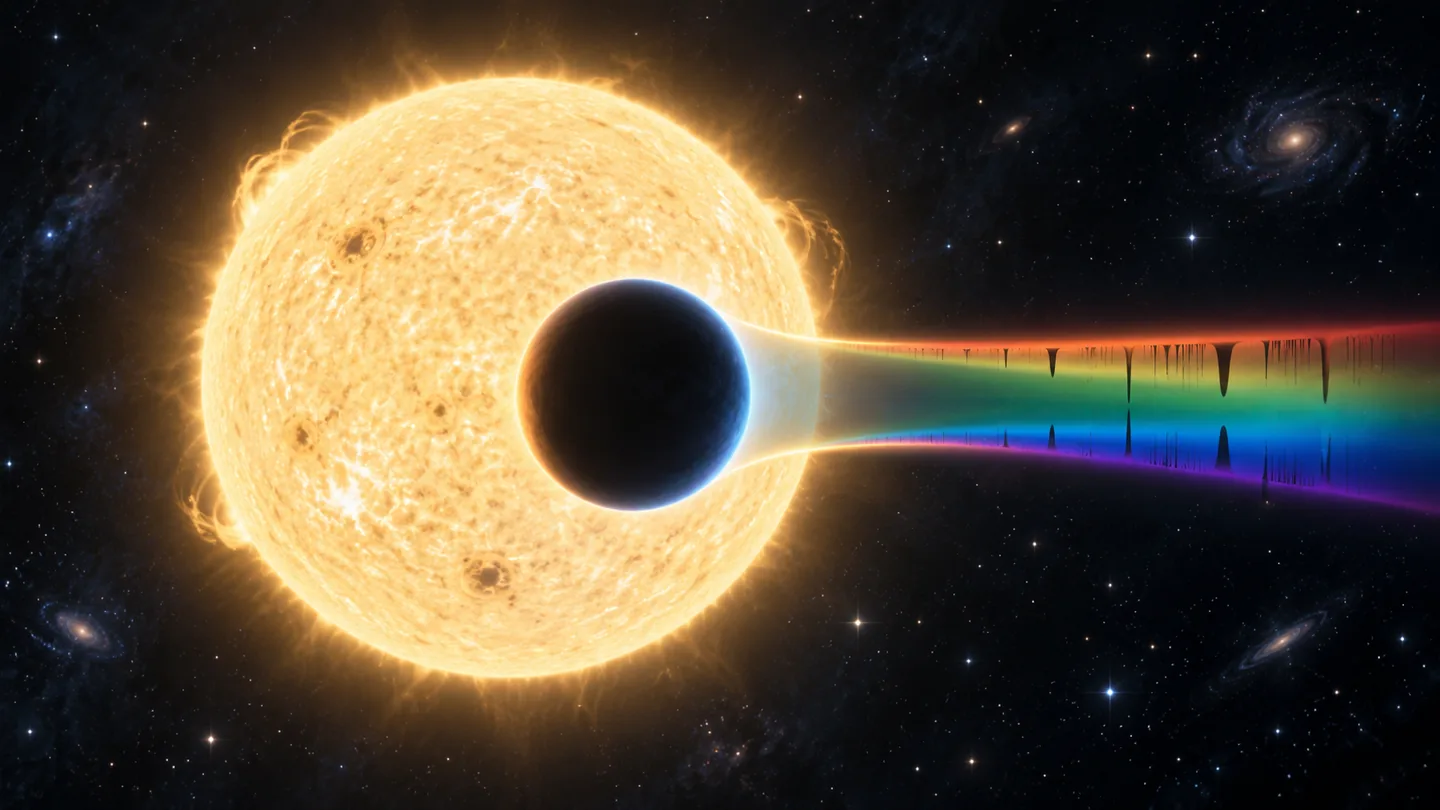
A tiny dimming with a spectrum inside it
Imagine watching a distant star while one of its planets passes in front. The planet blocks a small amount of starlight. If it has an atmosphere, some light also travels through the thin atmospheric edge before reaching a telescope. Molecules in that gas absorb particular wavelengths more readily than others.
Astronomers split the incoming light into wavelengths and compare how deep the transit appears across them. The planet’s apparent size can look slightly different from one wavelength to another because its atmosphere is not equally transparent everywhere. That wavelength-dependent pattern is called a transmission spectrum.
The basic method is a form of measurement by comparison—not a close-up photograph of the air. ESA describes the same principle for future Ariel observations: during a transit the measured spectrum combines the star and the atmosphere-filtered starlight; an observation when the planet is hidden can help isolate the star’s spectrum.
From a pattern to possible molecules
Molecules leave characteristic absorption features. Researchers compare the measured spectrum with models that predict how different atmospheric compositions, temperatures, clouds and pressures would shape the signal. The best-fitting models can support an inference about which gases are plausible and how abundant they may be.
“Support” matters. The data do not arrive with molecule names attached. ESA notes that spectral fingerprints can overlap, making different chemical explanations difficult to separate. A model is a way to test whether a proposed atmosphere could produce the observed pattern; it is not itself a direct sample of that atmosphere.
Clouds and hazes can flatten or obscure features by preventing light from probing deeper layers. NASA’s explanation of Rayleigh scattering likewise illustrates how scattering and clouds can change the visible spectral shape. Instrument sensitivity, wavelength coverage, stellar activity and assumptions in the atmospheric model all affect what can be inferred.
A real result can be a limit
Not every useful observation reveals a crisp chemical fingerprint. A published JWST study of the nearby Earth-sized planet GJ 341 b reported a featureless transmission spectrum consistent with several possibilities, including a high-altitude cloud deck, a tenuous atmosphere or no substantial atmosphere. That result illustrates a strength of careful inference: data can constrain explanations without selecting one uniquely.
The measured star is part of the experiment, too. Star spots and bright regions can alter the light entering the telescope and imitate or distort atmospheric features. Researchers therefore test for stellar contamination and compare alternative models rather than treating every bump as a planet molecule.
What the method can establish
With sufficient quality and context, transit spectroscopy can provide evidence for atmospheric components and help constrain temperature or cloud properties. Repeated observations across wavelength ranges can strengthen or challenge an interpretation. Independent methods, such as emission spectroscopy or direct imaging where feasible, can add different constraints.
But a spectral feature is not a photograph of the atmosphere, and identifying a molecule is not the same as discovering life. Even a candidate biosignature would need to be interpreted alongside the planet’s environment, other chemistry and non-biological explanations. ESA emphasizes that these conclusions are contextual and cumulative.
The satisfying part is also the honest part: astronomers learn about a world by measuring a very small change in starlight, then asking which physical models survive comparison with the data. The answer can be powerful while still carrying uncertainty—and saying where that uncertainty remains is part of the result.